Originally Posted on Interhacktives
So you want to learn how to use Google Data Studio, but aren’t sure where to start? I was in the same boat a couple of months ago. While it took some failed attempts to wrap my head around the ins and outs of the platform, it was well worth the effort.
Data Studio is a platform for data analysis, data visualization and reporting. You can connect it to tons of data sources, from Bigquery to social media channels, to your personal website metrics.
In this tutorial, I’ll be working from my presentation called “Women in Government for Strong Institutions, Peace & Justice” which was part of Google’s Visualize 2030 Competition. You can scroll through the full presentation and the other winners’ presentations here.
First things first, access data studio. Then, once you’re in the platform, you’ll want to connect your data source.

Connect Your Data Source
For this example, the key sources of data I used were World Development Indicators (WDIs) provided by the World Bank and Social Development Goals (SDGs) from the UN, both accessible via BigQuery. However, you can connect to virtually any kind of data source imaginable, including Google Analytics, Google Sheets, Github, Kaggle, Twitter and Facebook.
Once you’ve connected your data, it will be visible in your Data Sources. Now you can get cracking on your report.

Start a New Report
You may notice that there aren’t any tools visible at the top of your window, this is because you need to connect your report to a data source before the tools can populate in your window. Start by linking to the data source you already added to your repository.
I’m going to recreate Slide 8 of my presentation. Slide 8 only uses the world_bank_wdi_indicators data source. That’s the only data source I’ll connect to for this tutorial. However, it’s worth noting that it’s possible to connect to as many data sources as you like, from multiple platforms, and even blend the data as you please, throughout a report.
Creating a Map
Now I’ll get started on creating a map. Select Add a Chart > Geo Map. Drag the map to it’s desired location and resize as needed. The panel to the right is where you can adjust your map’s dimensions, metrics and regional display. I plan to show intentional homicides around the world, color-coded by density. I need to make sure my map filter reflects that particular metric.


Because the World Bank’s dataset is so massive, you need to know the specific indicator in order to call up your desired subset of data. Taking a look through WB’s indicator cheat sheet that I found on their website, I’ve located the indicator that calls up the global data for intentional homicide, VC.IHR.PSRC.P5.

Using Filters
Having located the indicator, I now select Create a Filter at the bottom of the right panel. The filter tool is probably the most important part of Google Data Studio. It allows you to form arguments that shape your data visualizations.

My argument will be straightforward. I only want to call up the data that falls under the umbrella of my chosen indicator, VC.IHR.PSRC.P5. You can see my argument below, but there are a lot of different filters you can make for your data based on this various arguments. Once you save the filter, it will show up in your panel and your map will update to reflect the intentional homicide rate in each country.

However, we still have a couple more things to fix before the map is complete.
Right now, the homicide rate displayed in the map is actually just a sum of the number of recorded data entries. For example, if homicide data wascollected 3 times in India over the past 25 years, the number that shows up on the map in India is 3. To remedy this, you simply click on Record Count, and switch it to Value. Then next to Value Click the edit icon, and switch to Average instead of Sum. This should update your data to reflect the correct intentional homicide rate as an average of the rates collected over the years.

To double check what your map is displaying, you can toggle between view and edit modes to see what your data looks.
Add a Filter Button for Interactivity
By now, your map is done! But there are a few extra touches you can add to make your report more interactive. Let’s add a button to allow viewers to toggle the data by year, in order to see how the intentional homicide rate has changed over time, rather than being restricted to the averaged view.
Click on the button that looks like a funnel called Filter Control.

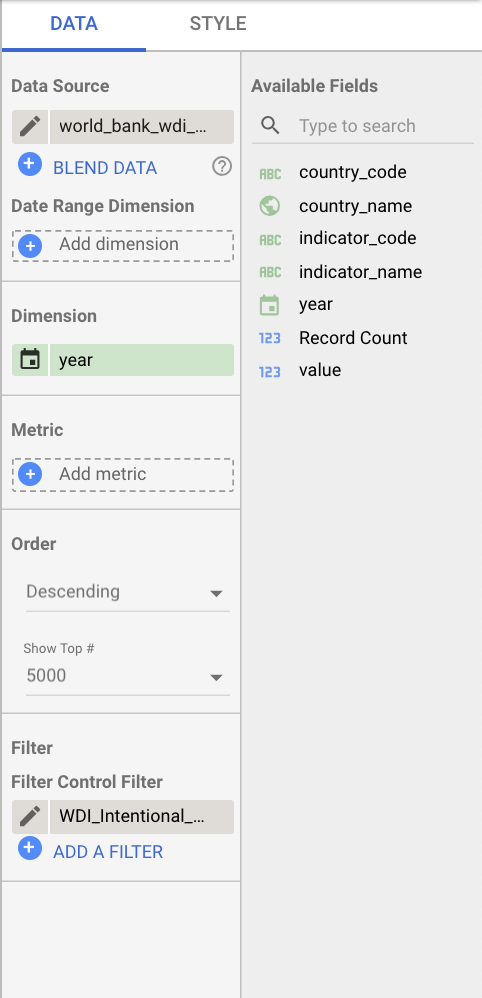
Move and size the new drop down as you please and then take a look at the panel to the right again. Just like we did for the map, we want to add a filter using our code for homicide, VC.IHR.PSRC.P5. This time, our data filter is already saved, and we can simply select it, rather than making a new filter. Under Dimension select year, so that we can toggle the data by year. Remove any other selected metrics. Your filter button settings should look like this….
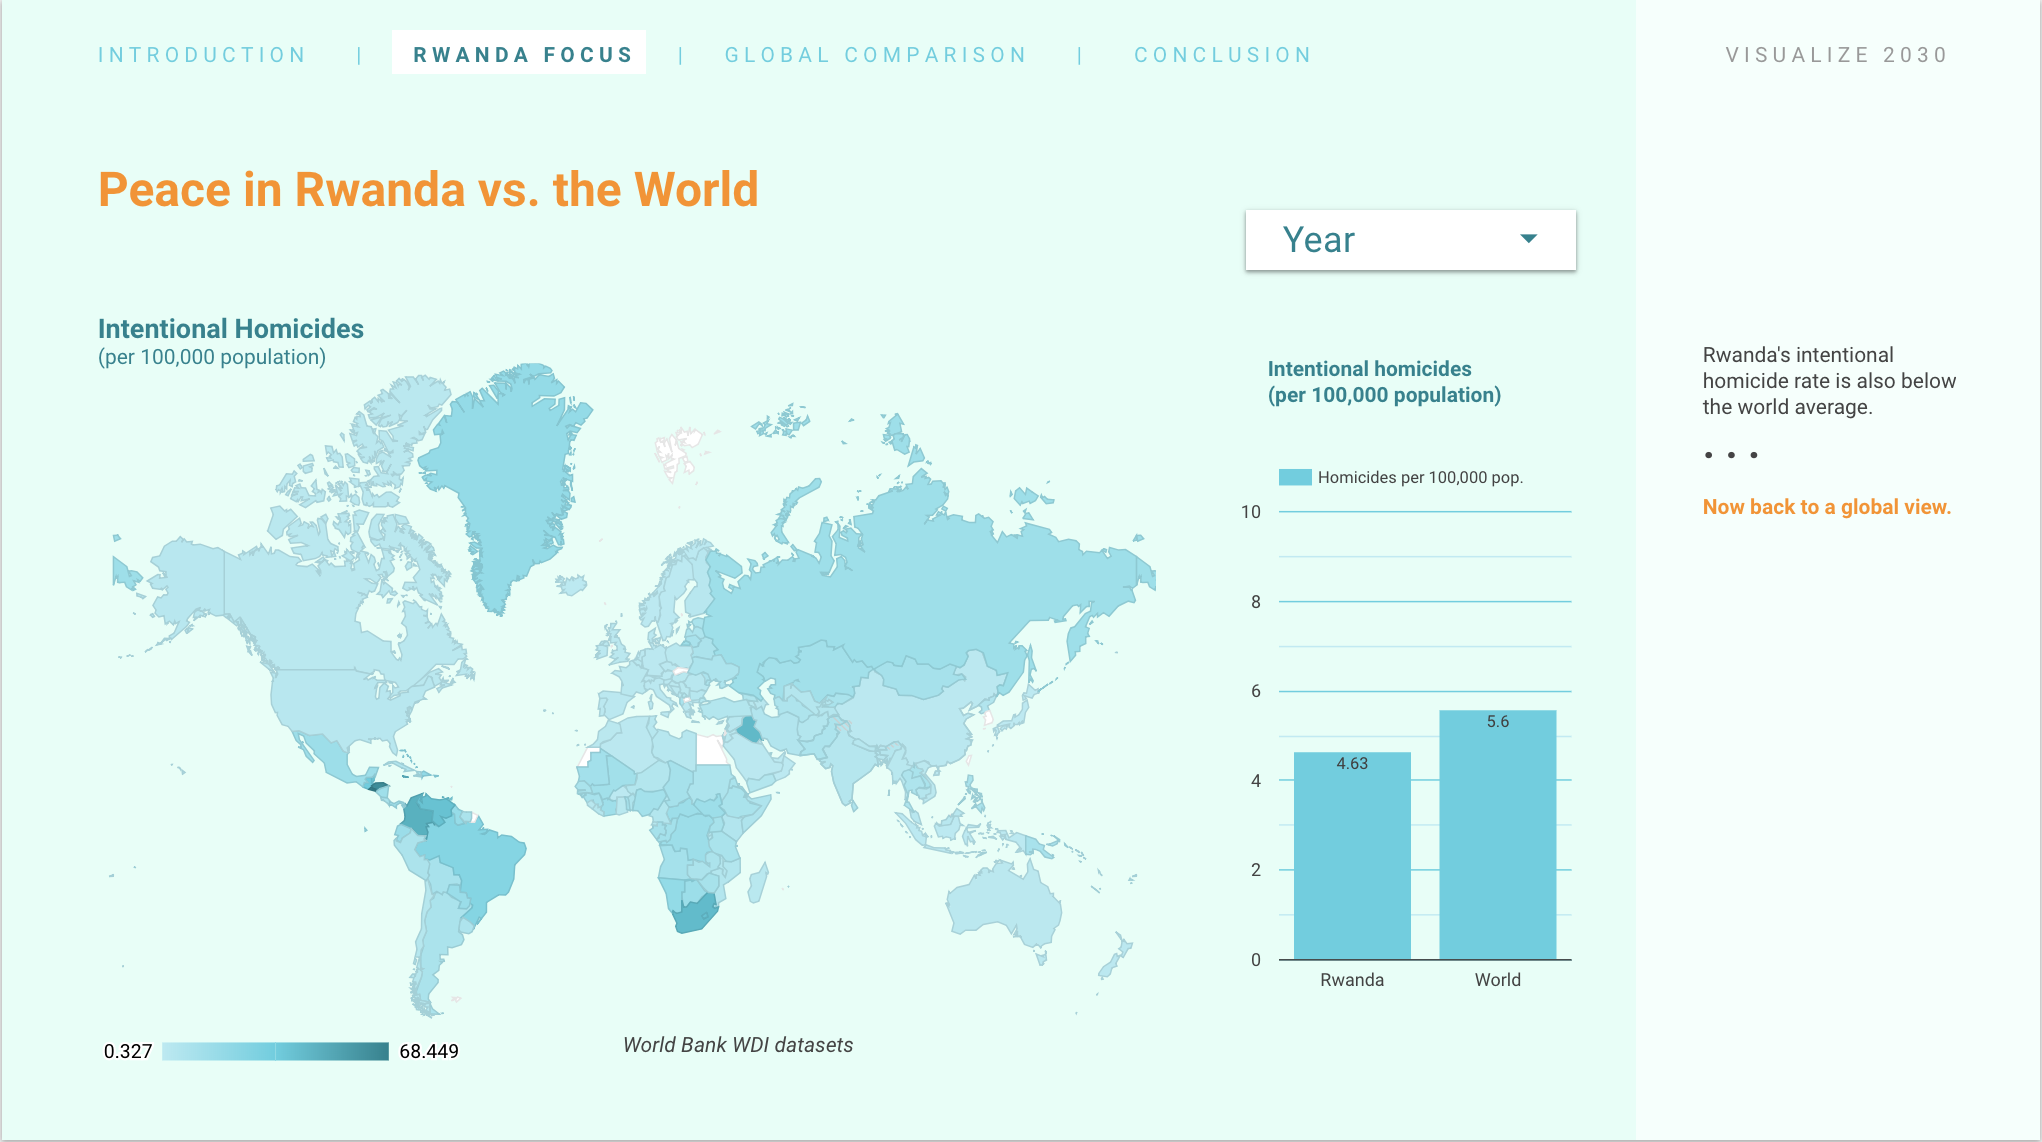
and this is what your report should now look like in view mode:

Duplicating a Graph
Now, I also want include a graph that compares Rwanda’s intentional homicide rate with the world’s. Here’s how to quickly duplicate the data used in our map into a small column graph.
Simply select the map and copy and paste it. Move and scale the new map. Then, at the top of the right panel, select the drop down and change the chart type to a Column Chart.

To display only Rwanda and the World average set the Dimension as Country_name, Metric as AVG Value, and Sort as Country_name. Finally, we’ll need to create a new Filter that includes an extra AND clause so that only the data for Rwanda and the World are called up. It will look like this:

Now you should have a beautiful column graph!
In view mode, you’ll also notice that the year filter button affects all the data on the page, which is just what we want. The only issue is that there are many years where neither the world nor Rwanda’s intentional homicide was collected, which sometimes leaves the column graph empty depending on the year selected.

Layout, Theme and Colors
Now that the hard part is done, you can change the look and feel of your report by using the Layout and Theme tool and by changing the Style of your graphs.


Once you’re done, your report will look something like this:

I hope this helped you begin your journey with Google Data Studio. There are many public datasets that you can use to learn Data Studio, so enjoy exploring!
To see some exemplary uses of Google Data Studio, you can check out the projects of the other winners of Google’s Visualize 2030 project, and check out some of the other reports in Google’s Data Studio Report Gallery.
Feel free to get in touch if you have any questions!